wandb beta leet terminal UI.
- App
- LEET
To view a specific run in the W&B App:
- Navigate to the W&B App.
- Navigate to the W&B project you specified when you initialized the run.
- Within the project sidebar, select the Workspace tab.
- Within the run selector, click the run you want to view, or enter a partial run name to filter for matching runs.
< >) are placeholders for the actual values of the team name, project name, and run ID.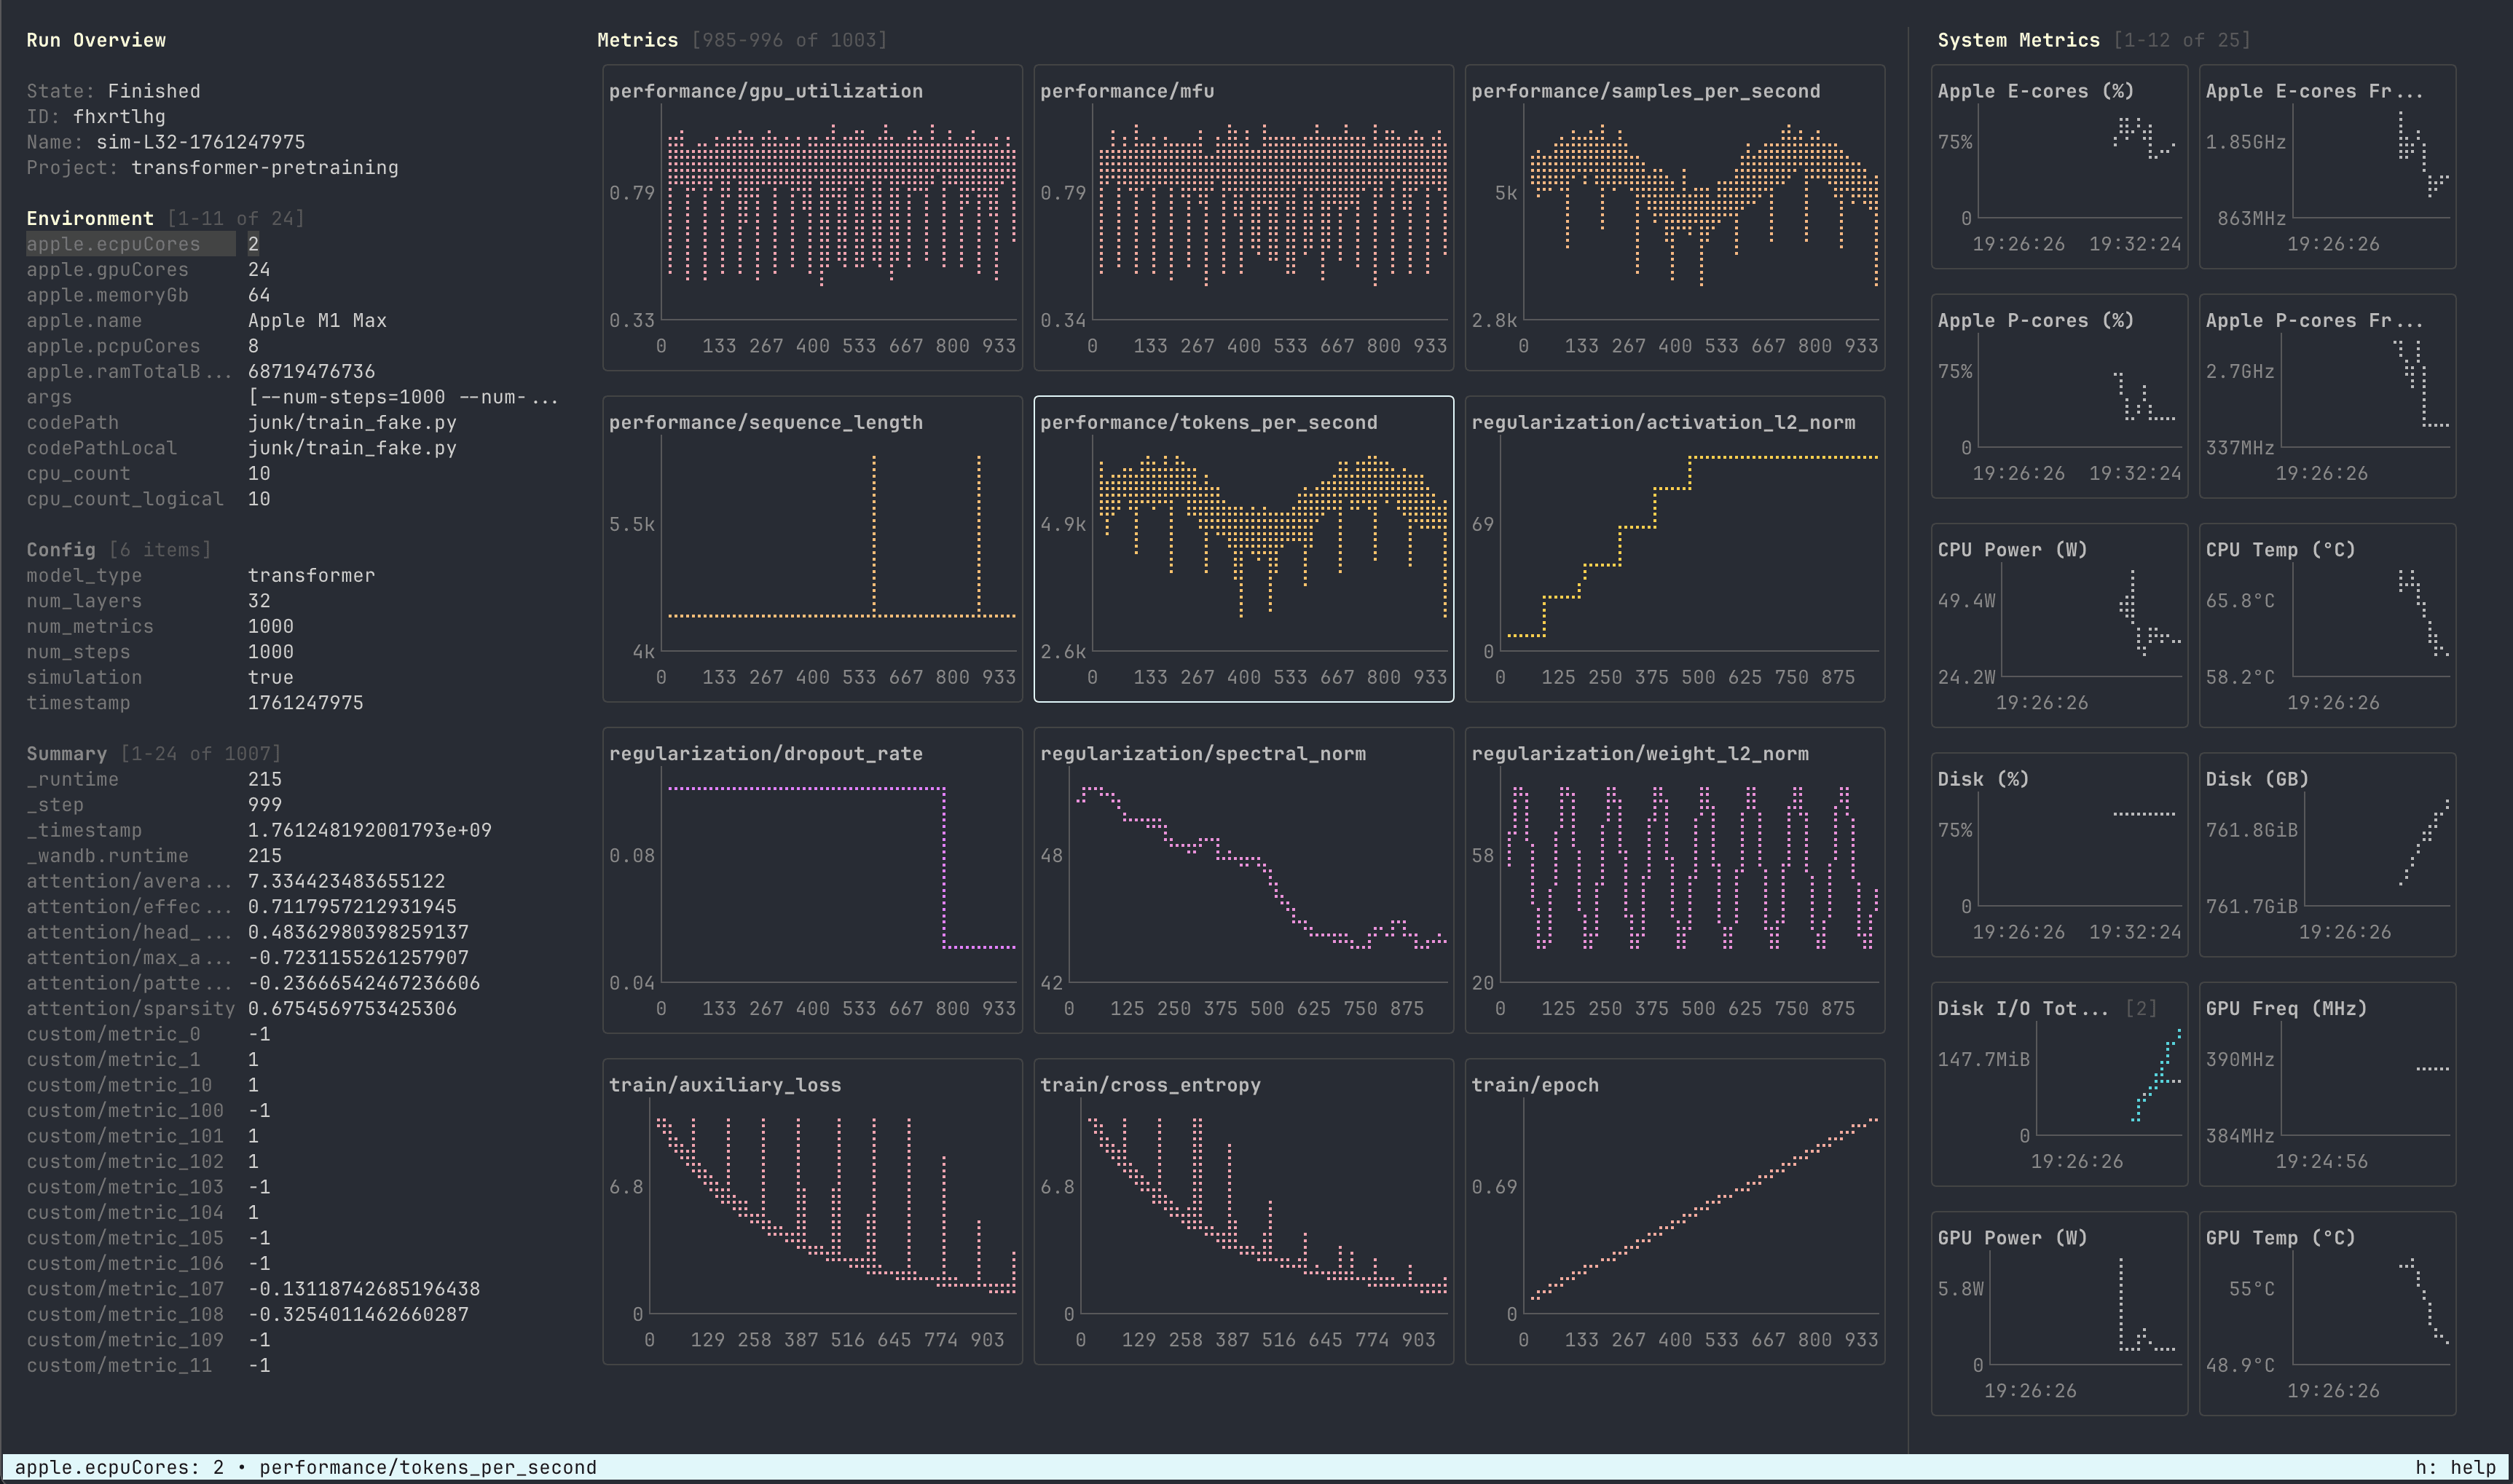
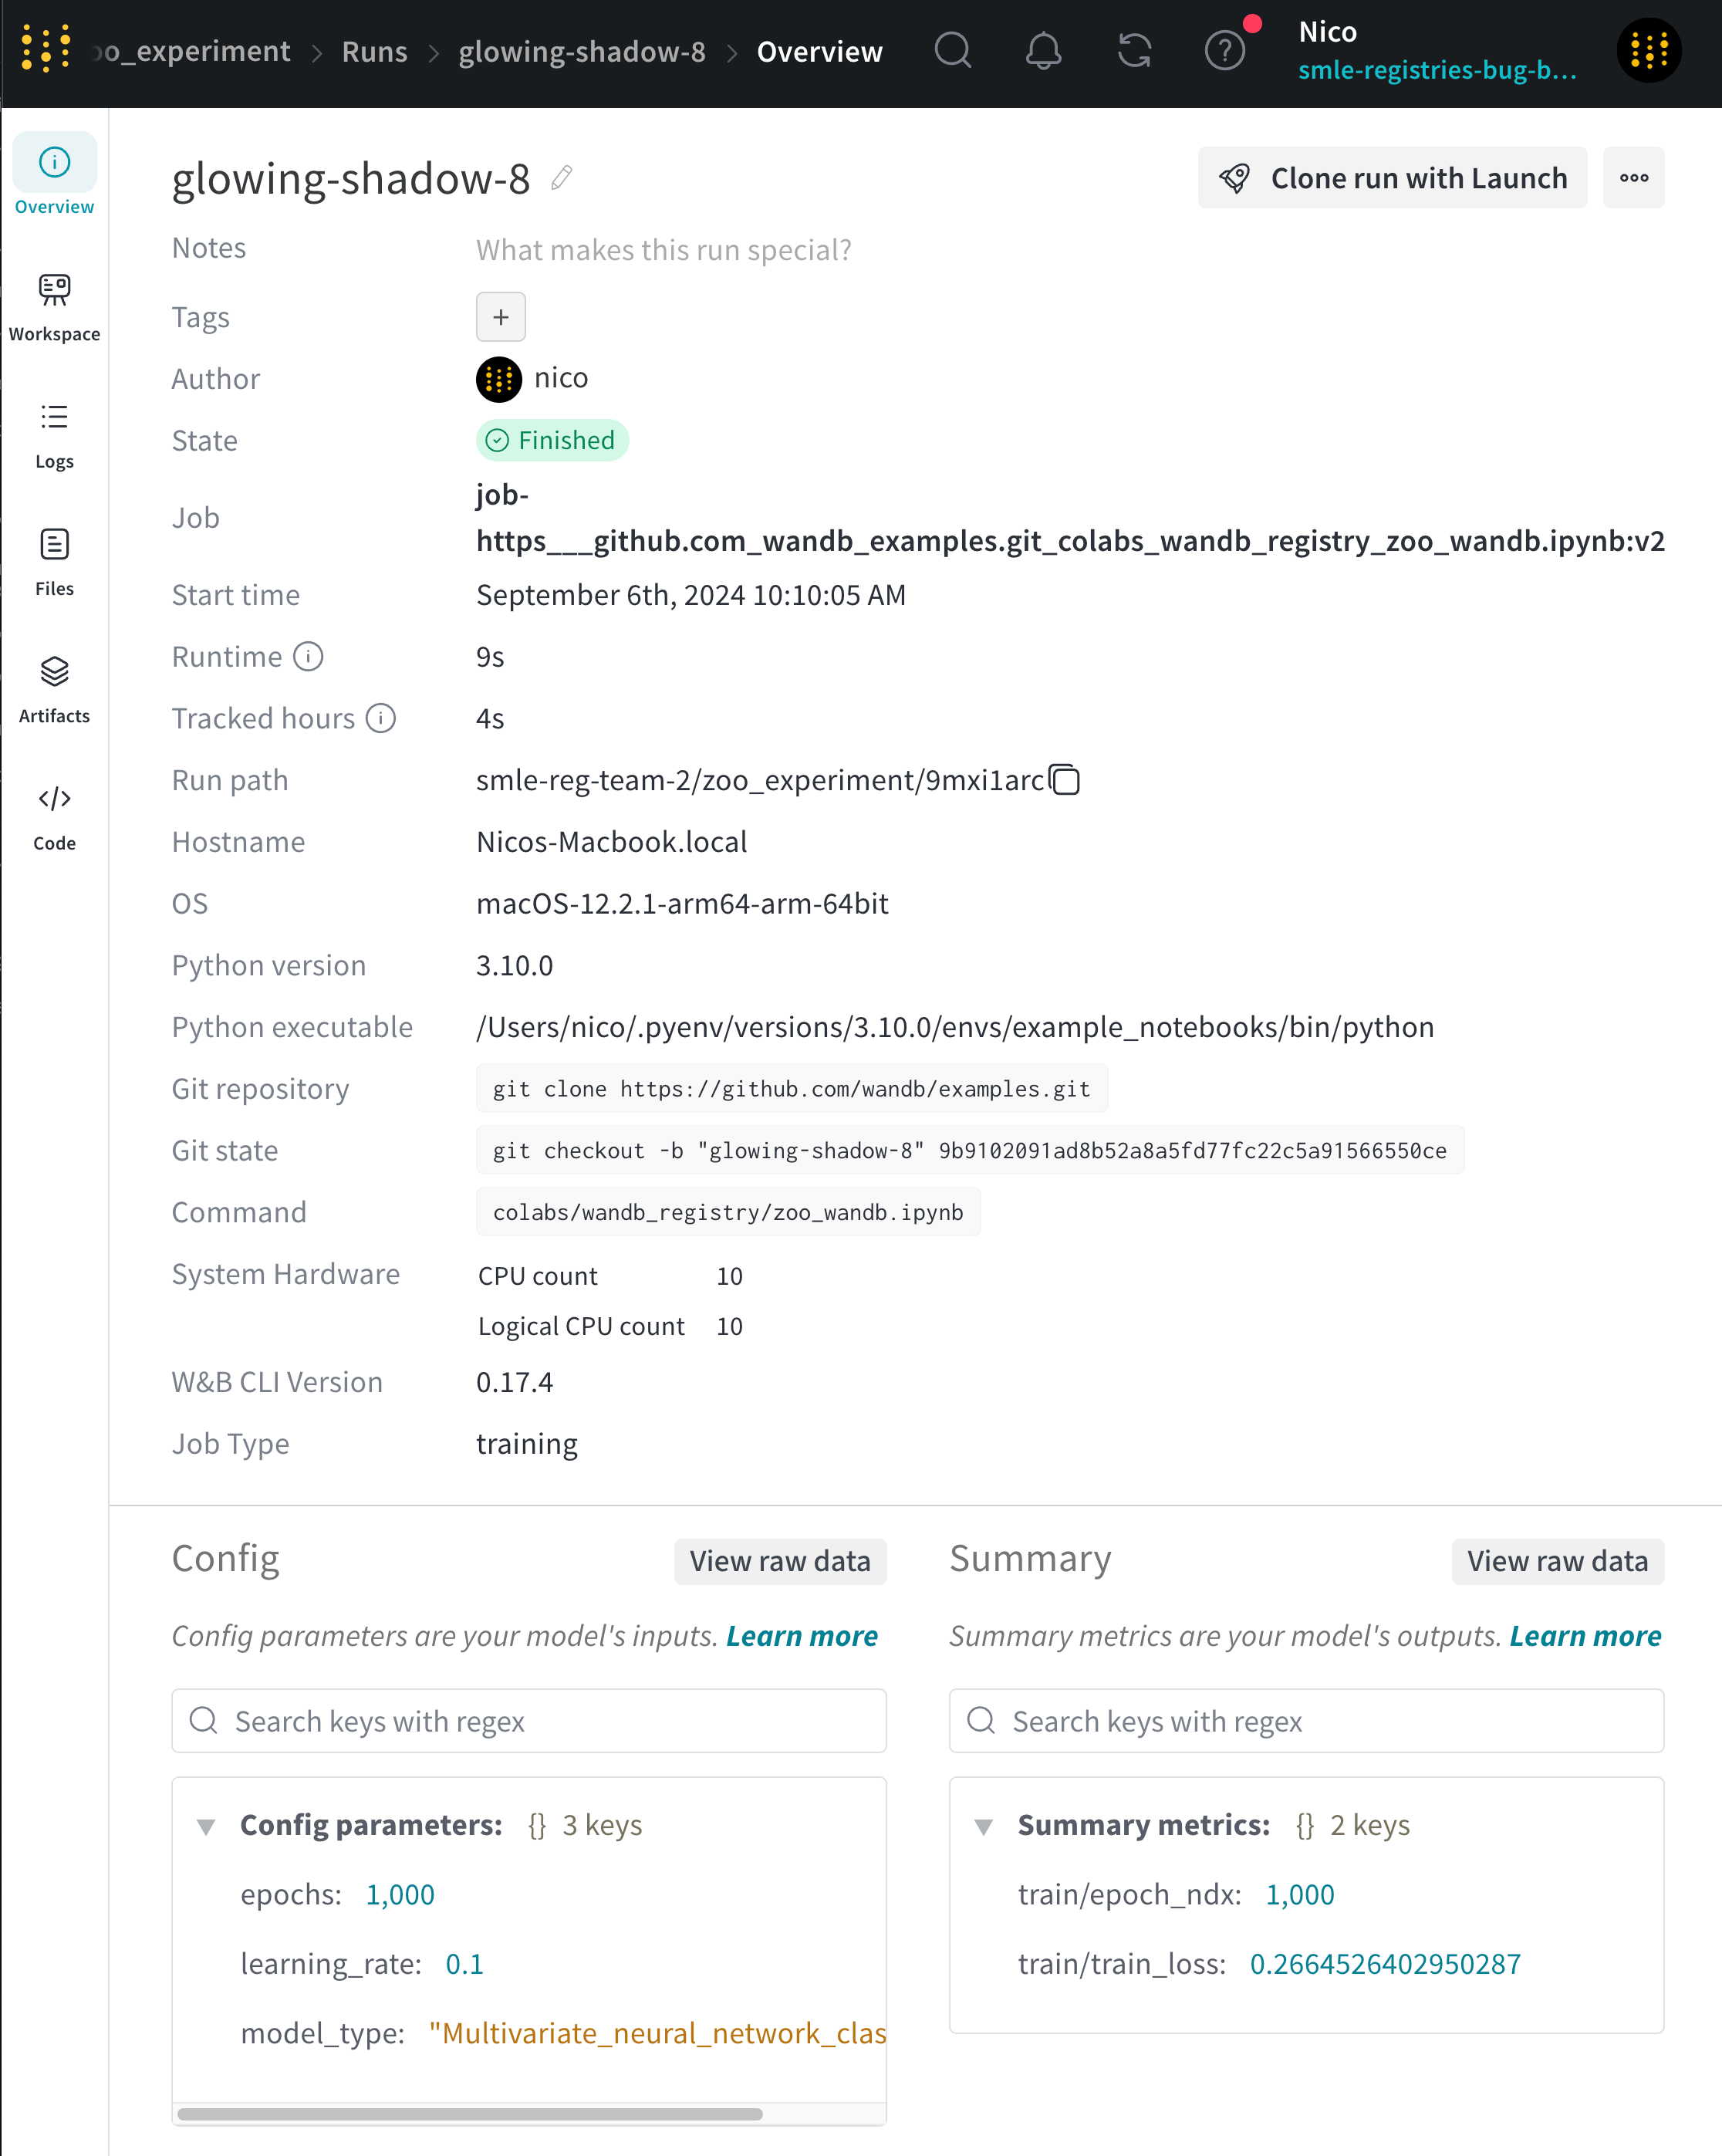
Overview tab
Use the Overview tab to learn about specific run information in a project, such as:- Author: The W&B entity that creates the run.
- Command: The command that initializes the run.
- Description: A description of the run that you provided. This field is empty if you do not specify a description when you create the run. You can add a description to a run with the W&B App UI or programmatically with the Python SDK.
- Tracked Hours: The amount of time the run is actively computing or logging data, excluding any pauses or waiting periods. This metric helps you understand the actual computational time spent on your run.
- Runtime: Measures the total time from the start to the end of the run. It’s the wall-clock time for the run, including any time where the run is paused or waiting for resources. This metric provides the complete elapsed time for your run.
- Git repository: The git repository associated with the run. You must enable git to view this field.
- Host name: Where W&B computes the run. W&B displays the name of your machine if you initialize the run locally on your machine.
- Name: The name of the run.
- OS: Operating system that initializes the run.
- Python executable: The command that starts the run.
- Python version: Specifies the Python version that creates the run.
- Run path: Identifies the unique run identifier in the form
entity/project/run-ID. - Start time: The timestamp when you initialize the run.
- State: The state of the run.
- System hardware: The hardware W&B uses to compute the run.
- Tags: A list of strings. Tags are useful for organizing related runs together or applying temporary labels like
baselineorproduction. - W&B CLI version: The W&B CLI version installed on the machine that hosted the run command.
- Git state: The most recent git commit SHA of a repository or working directory where the run is initialized. This field is empty if you do not enable Git when you create the run or if the git information is not available.
- Artifact Outputs: Artifact outputs produced by the run.
- Config: List of config parameters saved with
wandb.Run.config. - Summary: List of summary parameters saved with
wandb.Run.log(). By default, W&B sets this value to the last value logged.
Workspace tab
Use the Workspace tab to view, search, group, and arrange visualizations such as autogenerated and custom plots, system metrics, and more.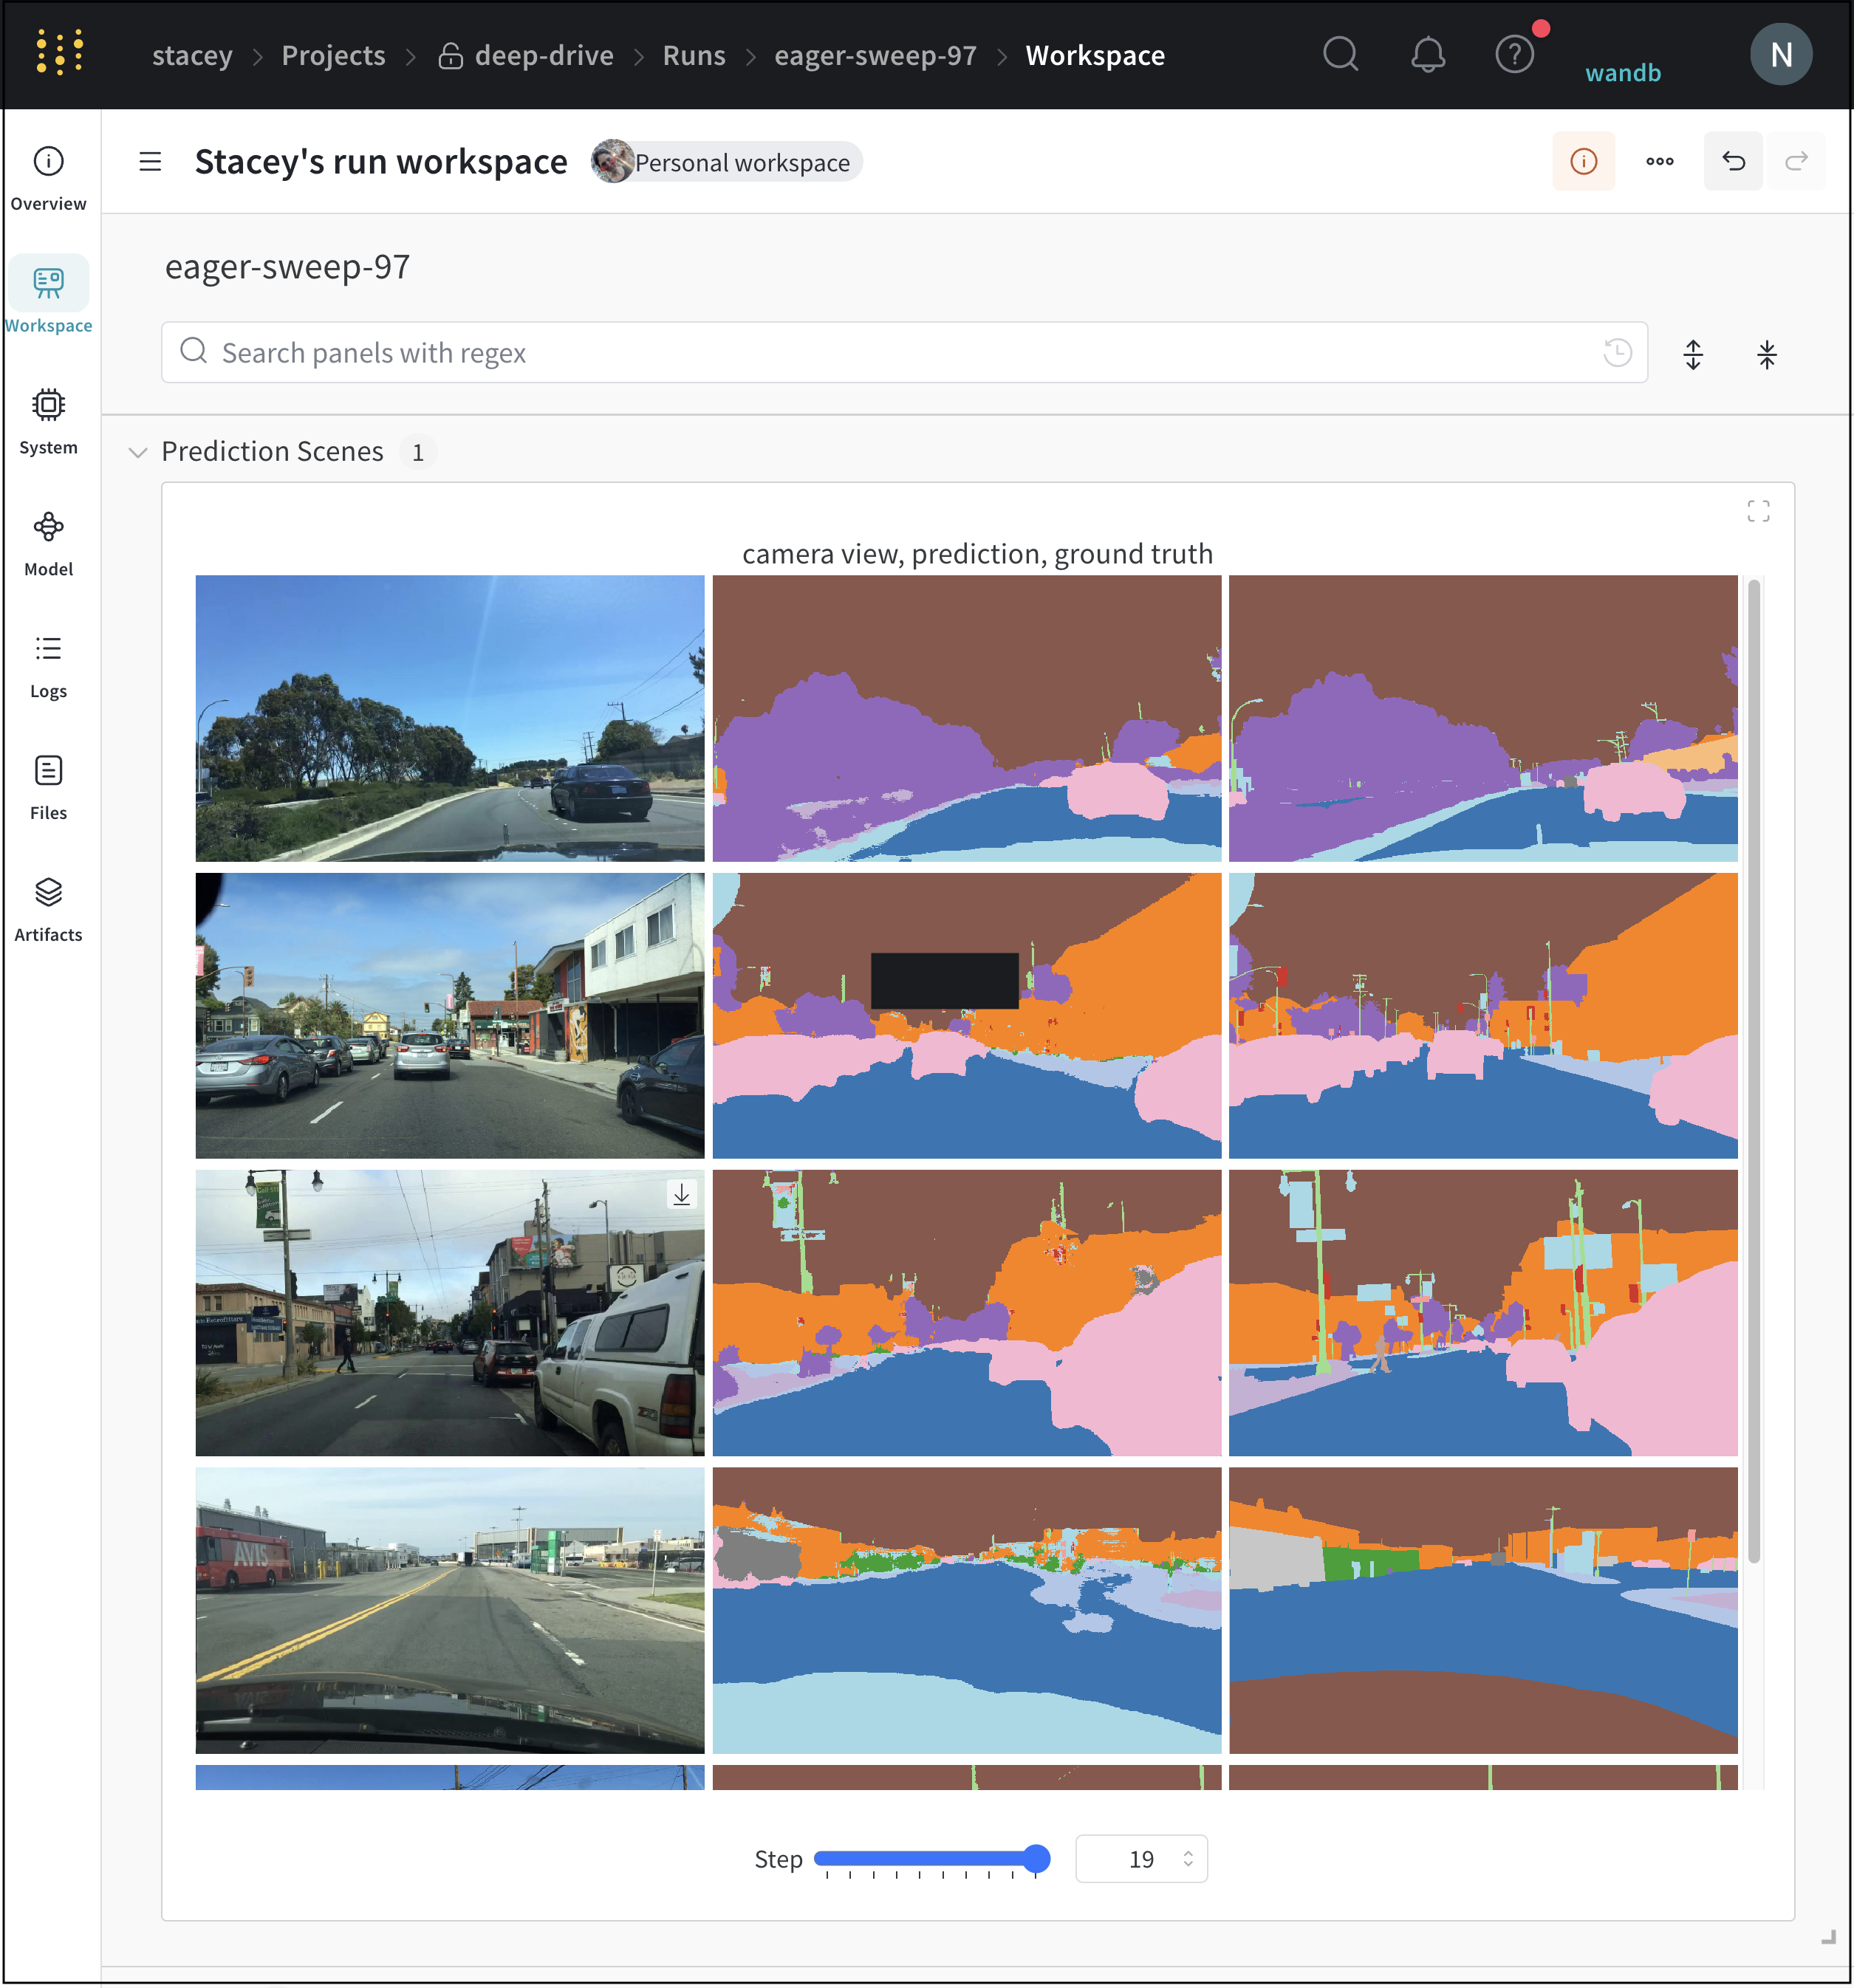
Runs tab
Use the Runs tab to filter, group, and sort your runs.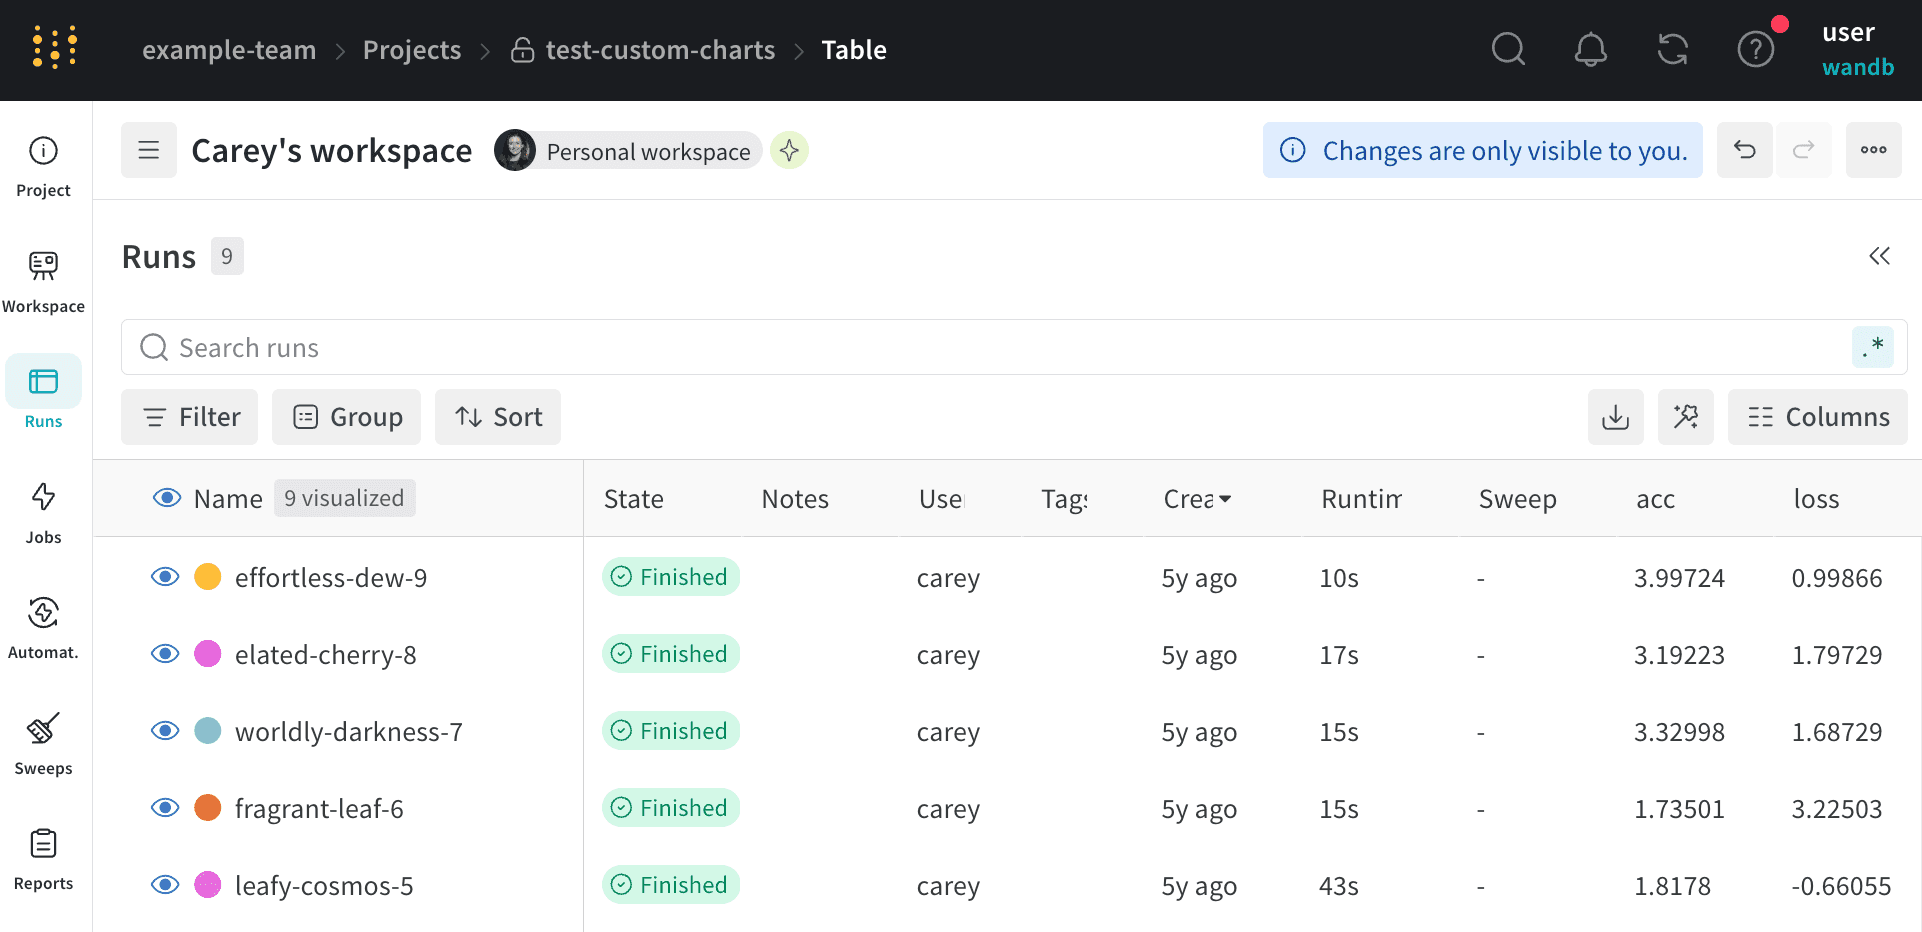
- Customize columns
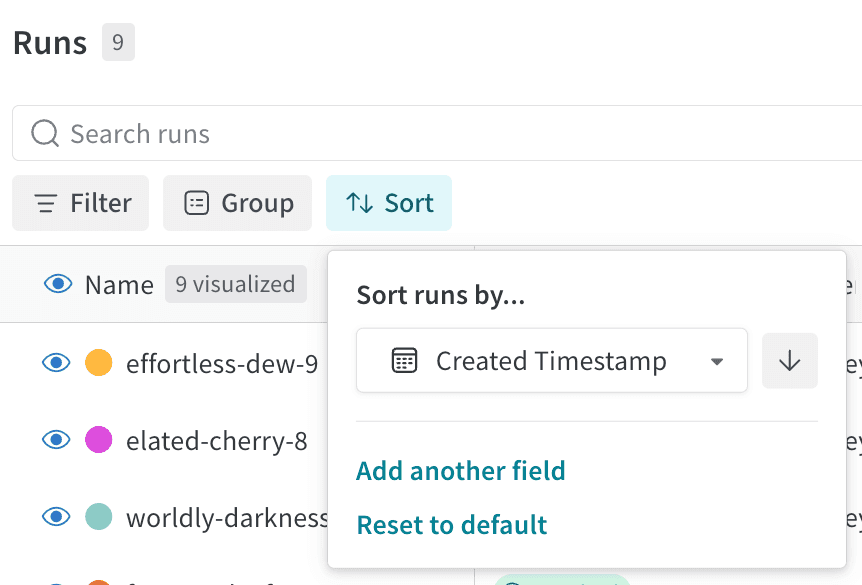
- Sort
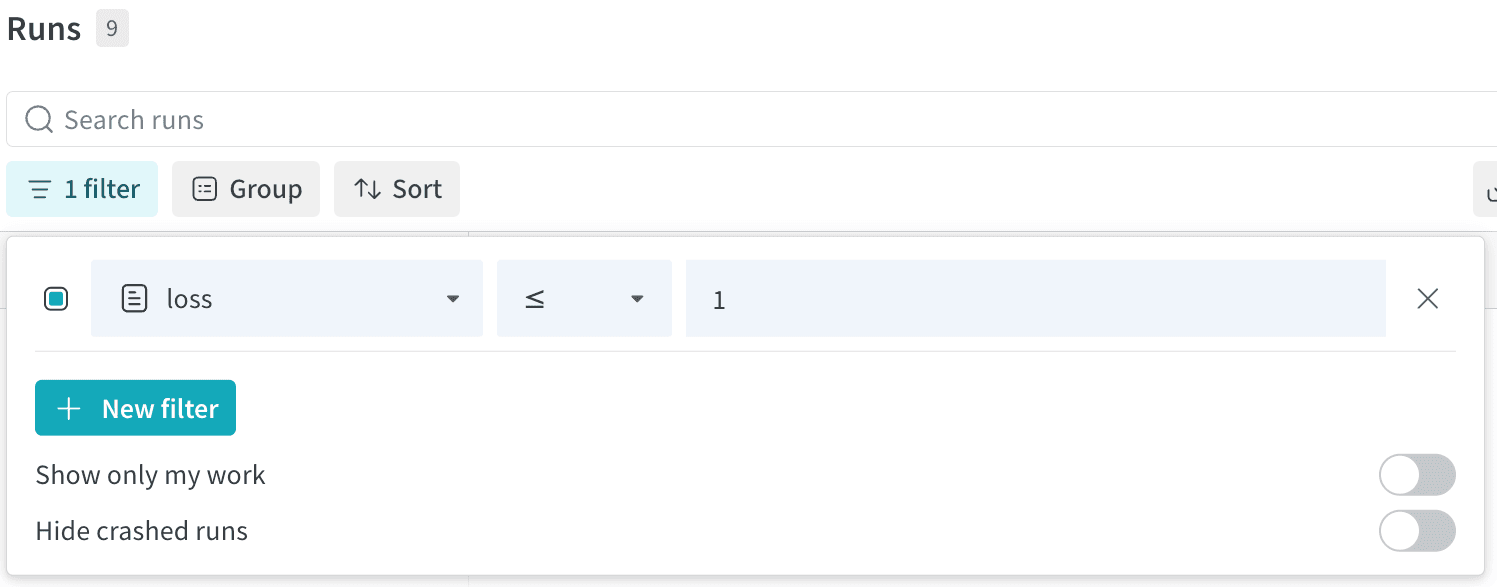
- Filter
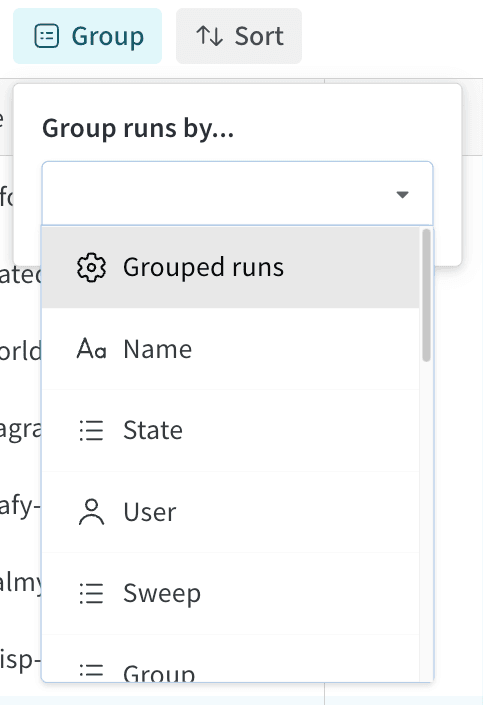
- Group
The Runs tab shows details about runs in the project. It shows a large number of columns by default.
- To view all visible columns, scroll the page horizontally.
- To change the order of the columns, drag a column to the left or right.
- To pin a column, hover over the column name, click the action menu
.... that appears, then click Pin column. Pinned columns appear near the left of the page, after the Name column. To unpin a pinned column, choose Unpin column - To hide a column, hover over the column name, click the action menu
.... that appears, then click Hide column. To view all columns that are currently hidden, click Columns. - To show, hide, pin, and unpin multiple columns at once, click Columns.
- Click the name of a hidden column to unhide it.
- Click the name of a visible column to hide it.
- Click the pin icon next to a visible column to pin it.
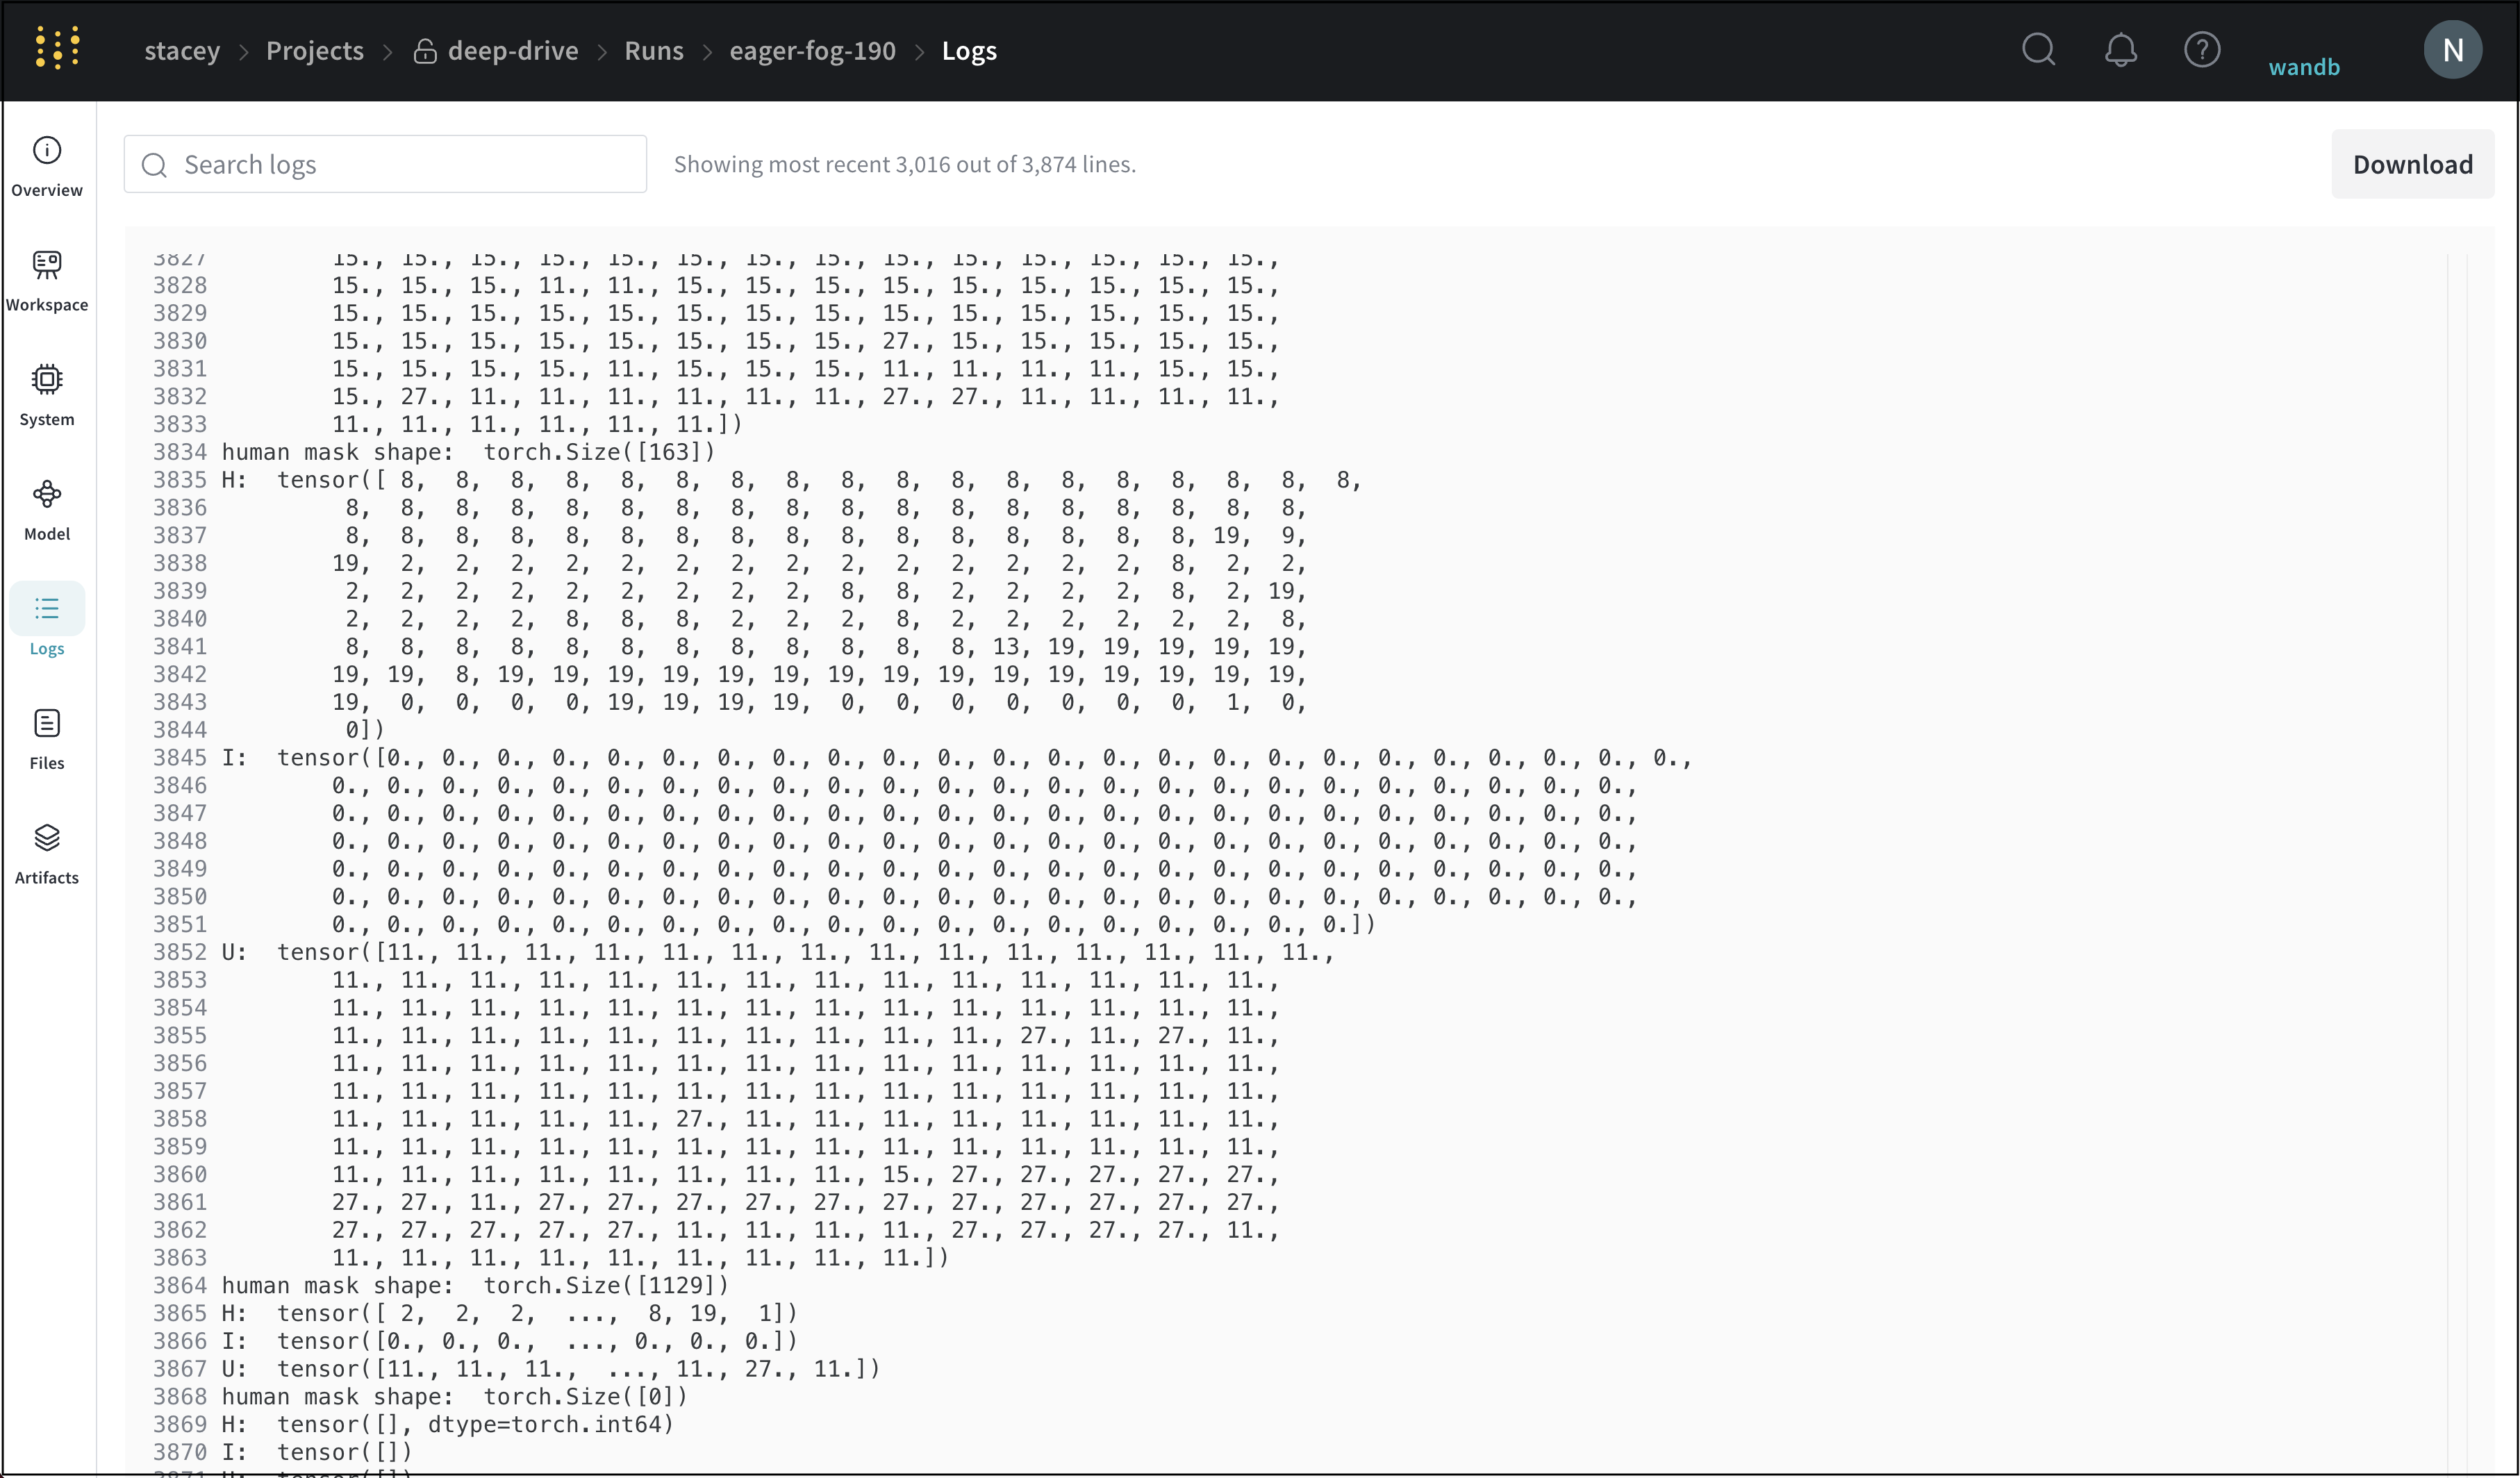
Logs tab
The Log tab shows output printed on the command line such as the standard output (stdout) and standard error (stderr).
Choose the Download button in the upper right hand corner to download the log file.
Files tab
Use the Files tab to view files associated with a specific run such as model checkpoints, validation set examples, and more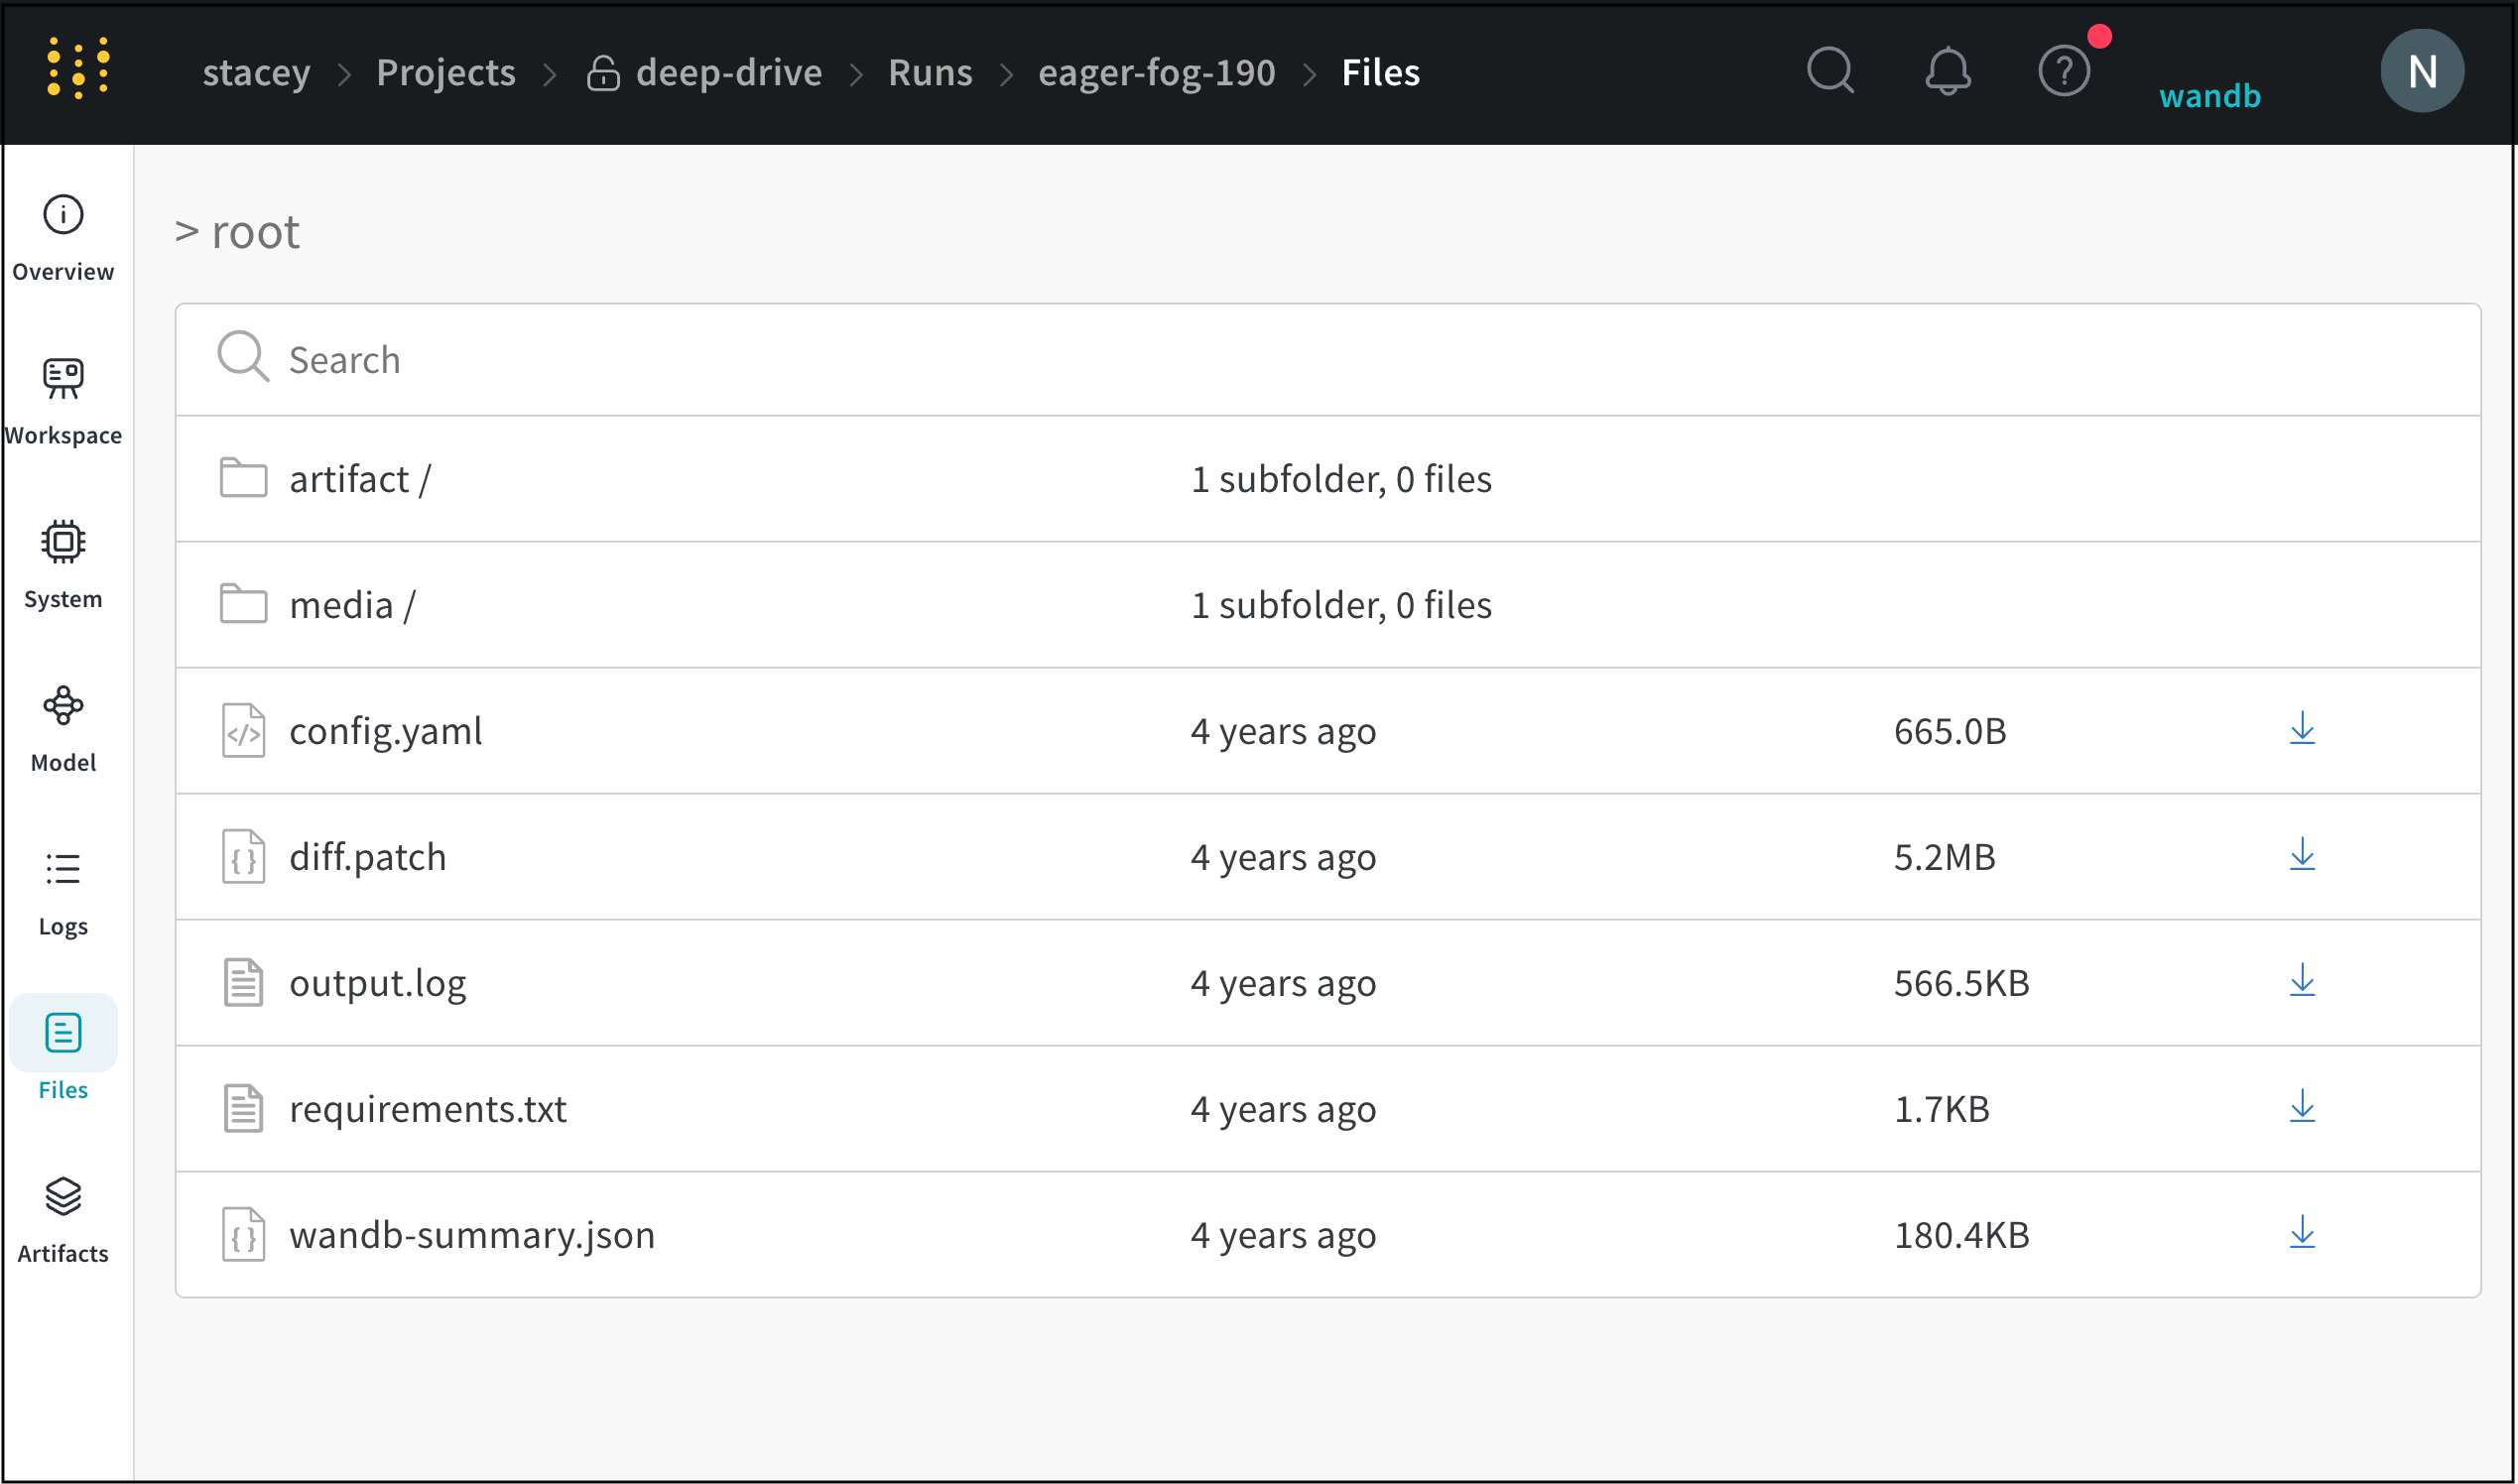
Artifacts tab
The Artifacts tab lists the input and output artifacts for the specified run.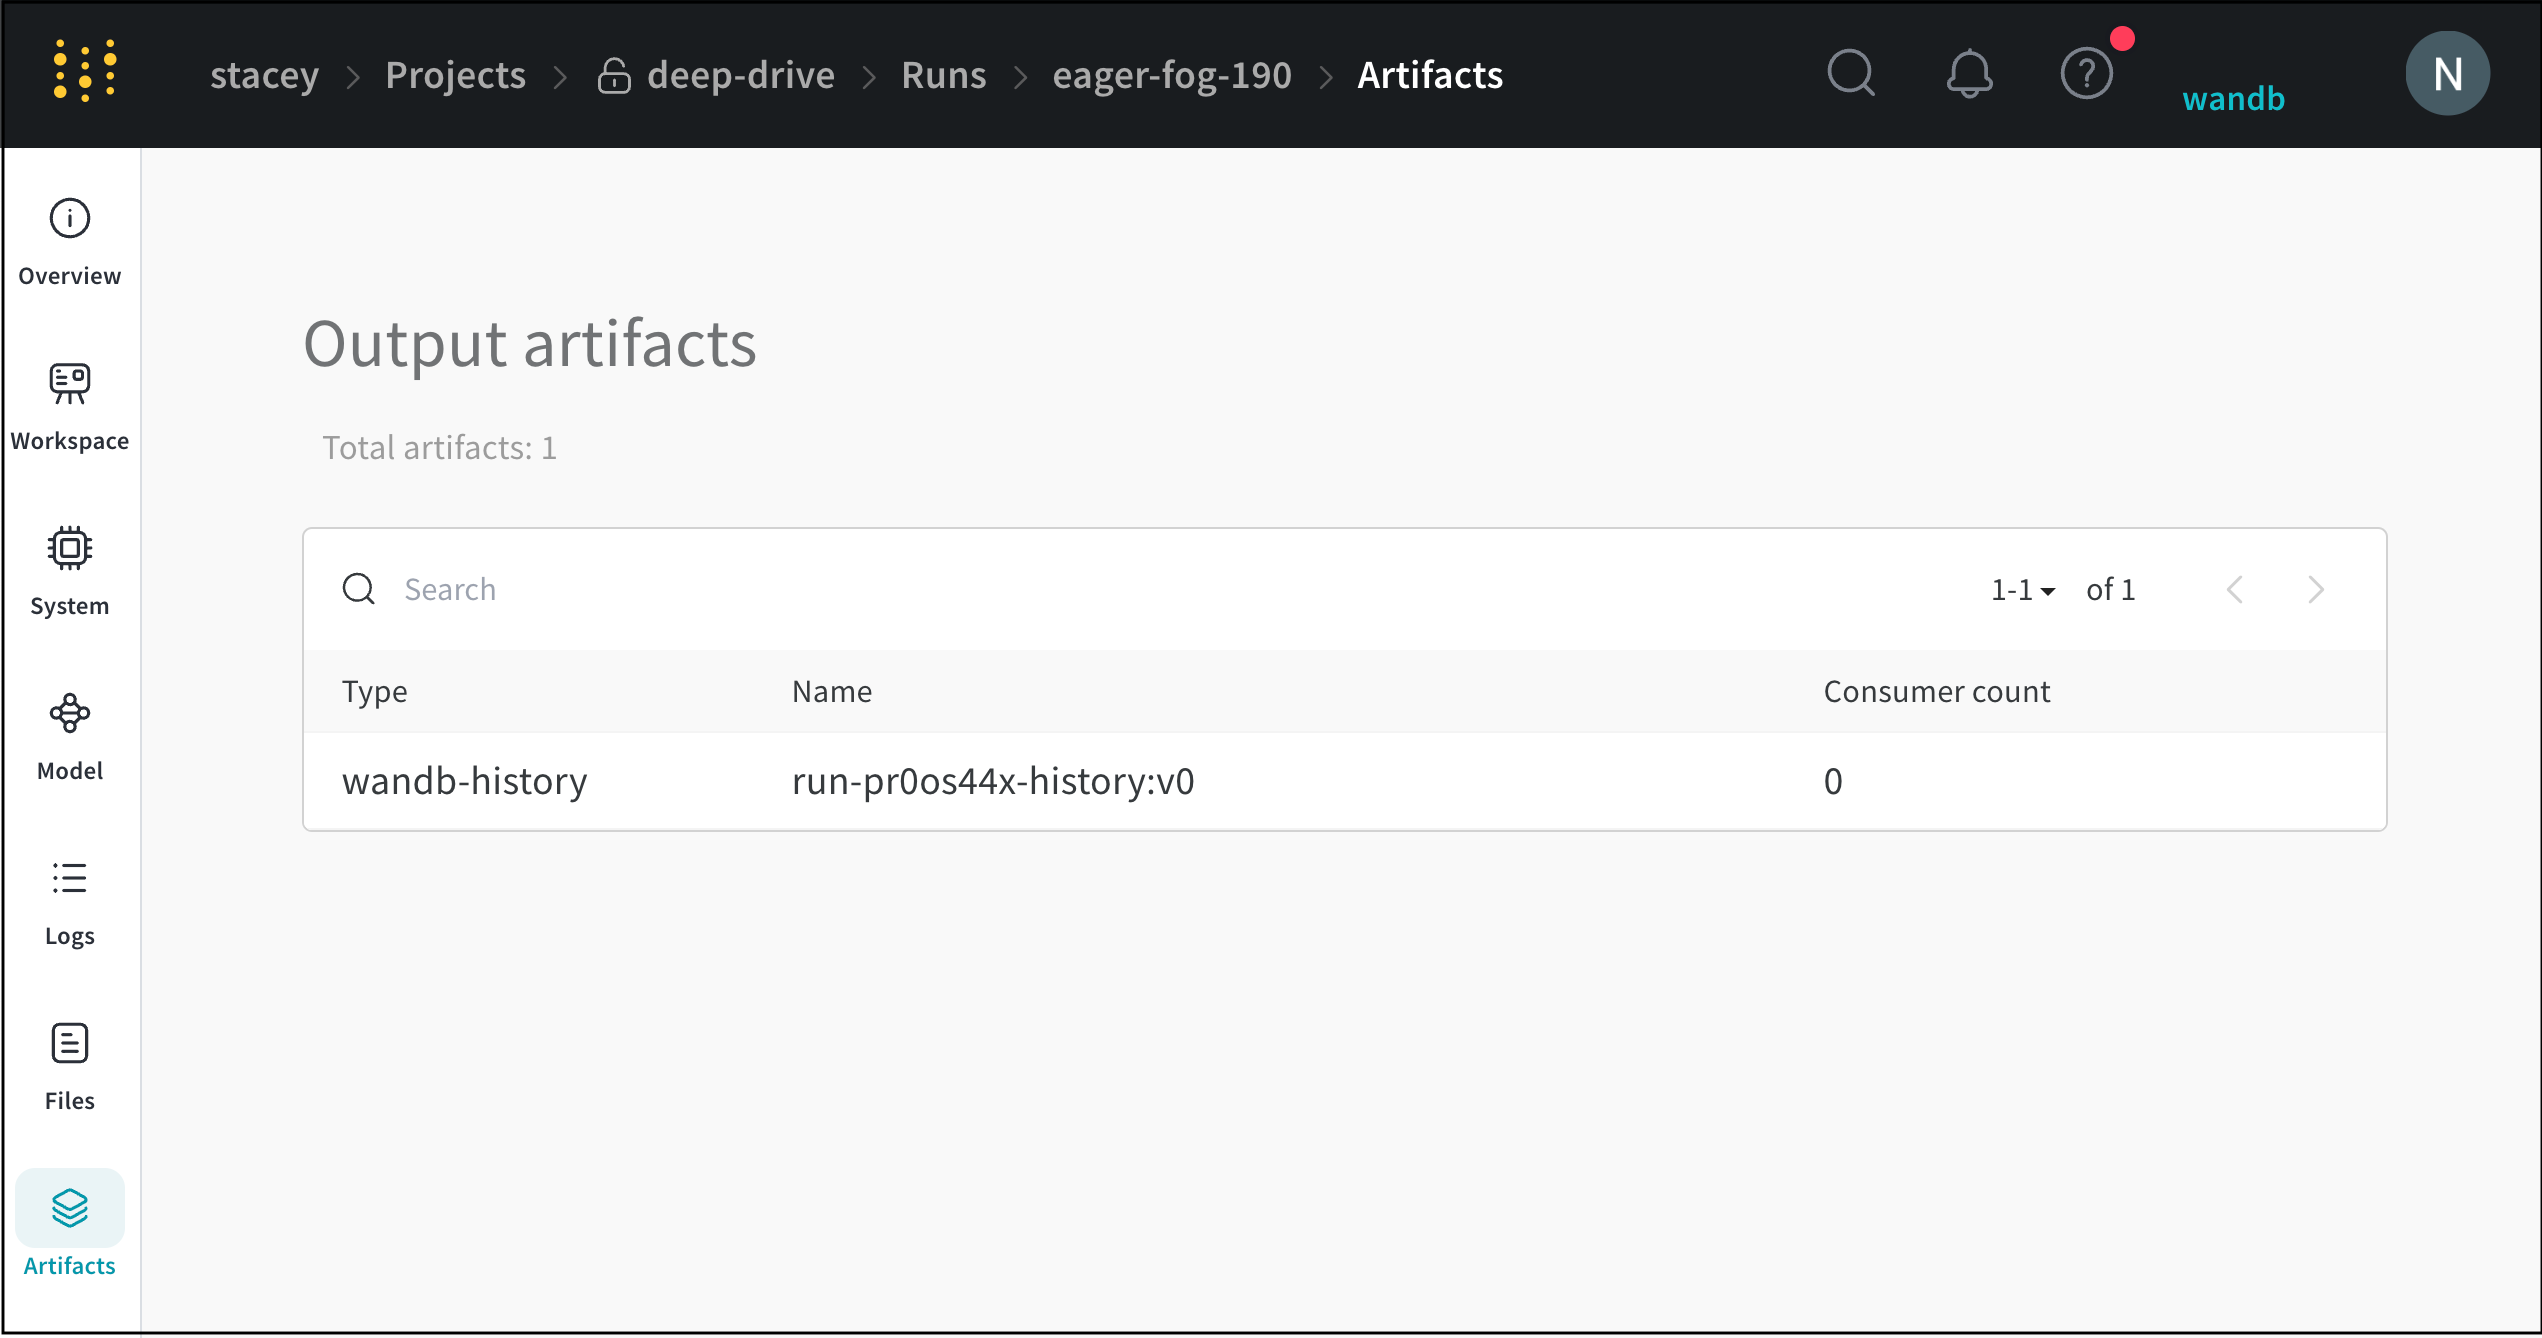
Export runs table to CSV
Export the table of all your runs, hyperparameters, and summary metrics to a CSV with the download button.